50 Slideshow Ideas SaaS Teams Instagram 2026
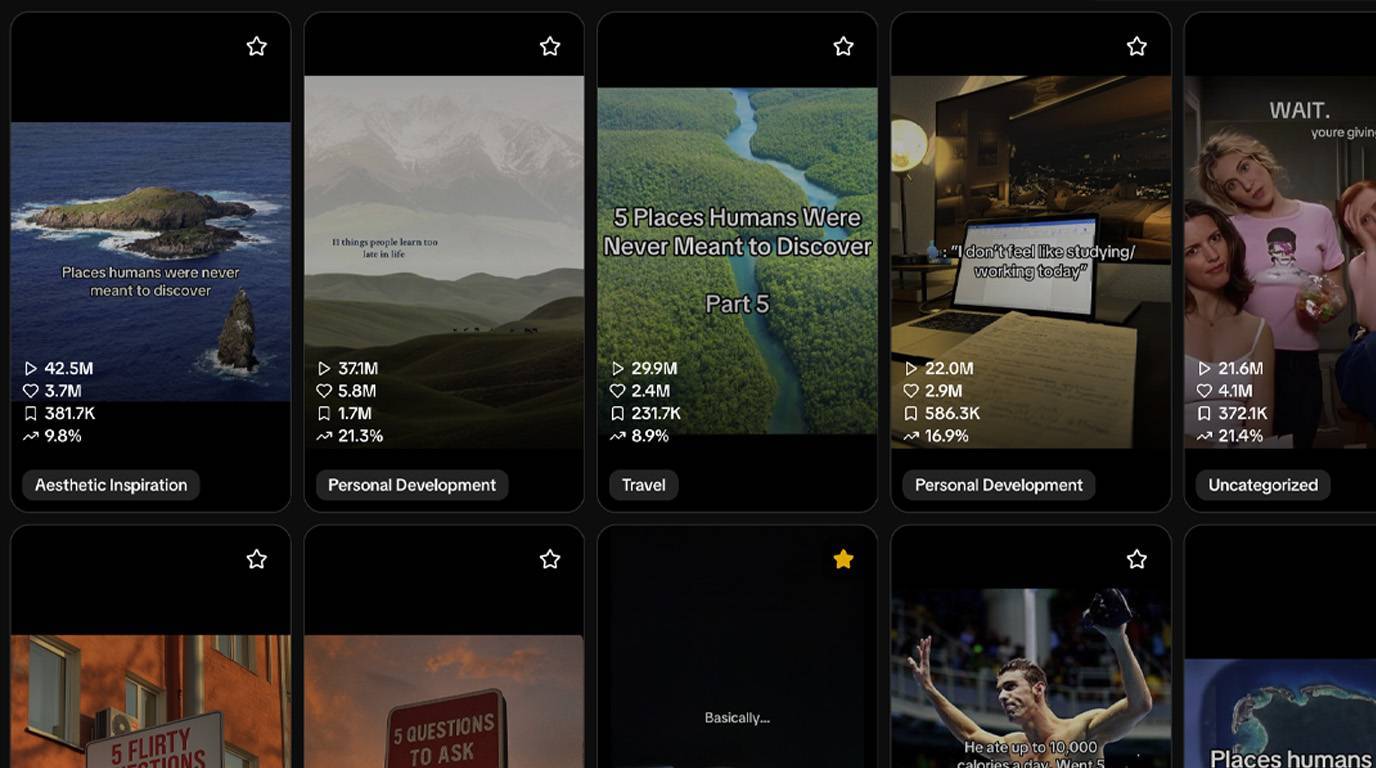
This collection provides 50 ready-to-produce image slideshow concepts tailored for SaaS founders and growth marketers. Each idea uses faceless formats like listicles, carousels, and breakdowns to deliver educational value on topics such as feature explainers, onboarding tips, churn reduction, and organic growth strategies. Produce these with text overlays, stock images, screenshots, and music to drive saves, shares, and signups without showing faces or relying on paid ads.
Showing 51 of 51 content ideas
5 Common SaaS Onboarding Mistakes and Fixes
8-slide educational carousel: slide 1 poses a question about high drop-off rates, slides 2-6 detail one mistake with a fix using bullet points, slide 7 shows a success metric example, slide 8 has a CTA to optimize onboarding. Use stock images of user flows, simple icons for steps, and data charts. This format gets saves from founders fixing user retention issues.
Before vs After: SaaS Pricing Page Redesign
6-slide before/after slideshow: slides 1-3 show cluttered pricing page elements with issues, slides 4-6 display clean redesigned versions with conversion tips. Include annotated screenshots of generic pricing pages and arrow graphics for changes. Viewers save to benchmark their own pages for better signups.
7 Steps to Product-Led Growth in SaaS
9-slide step-by-step guide slideshow: slide 1 hooks with a growth stat, slides 2-8 outline one step with icon and text, slide 9 summarizes with CTA. Feature minimalist icons, flowcharts, and progress bar visuals. Step-by-step structures encourage shares among growth marketers.
Churn Rate Benchmarks by SaaS Stage
7-slide data visualization slides: slide 1 introduces churn metrics, slides 2-6 show bar charts for early, mid, late-stage SaaS, slide 7 lists reduction tactics. Use custom graphs, color-coded stages, and trend lines from public data. Data slides position you as an authority and get profile visits.
4 SaaS Feature Prioritization Frameworks
6-slide comparison slideshow: slide 1 asks prioritization question, slides 2-5 compare one framework with pros/cons grid, slide 6 recommends next steps. Employ matrix diagrams, tables, and value vs effort icons. Comparisons help busy founders decide quickly, boosting saves.
User Onboarding Flow Optimization Checklist
10-slide tips carousel: slide 1 hooks with drop-off stat, slides 2-9 list one checklist item with icon, slide 10 CTAs to implement. Use checkmark graphics, simple illustrations of flows, and bold text overlays. Checklists are highly savable for repeatable SaaS tasks.
SaaS Freemium Model Pros and Cons
8-slide educational carousel: slide 1 defines freemium, slides 2-4 list pros with examples, slides 5-7 cons with metrics, slide 8 decision guide. Include balance scale icons, metric screenshots, and split layouts. Balanced views build trust and spark discussions.
Metrics to Track for SaaS Activation Rates
7-slide listicle slideshow: slide 1 explains activation, slides 2-6 one metric with definition and benchmark, slide 7 dashboard mockup. Feature gauge icons, line graphs, and number visuals. Metric lists get shared in founder communities.
SaaS Landing Page Copy Formulas
9-slide tips carousel: slide 1 hooks with conversion stat, slides 2-8 one formula with before/after text, slide 9 CTA. Use text bubble mockups, highlight annotations, and clean typography. Copy formulas save time for non-writers.
Red Flags in SaaS Customer Feedback
6-slide educational carousel: slide 1 introduces feedback analysis, slides 2-5 one red flag with example quote and fix, slide 6 summary. Employ warning icons, quote bubbles, and color-coded alerts. Problem-spotting content drives engagement.
Tiered Pricing Structures Explained
8-slide comparison slideshow: slide 1 overviews tiers, slides 2-4 basic/mid/premium breakdowns, slides 5-7 comparison table, slide 8 tips. Use stacked bar visuals, feature matrices, and pricing tag icons. Pricing breakdowns address common founder debates.
Daily Habits for SaaS Product Managers
7-slide listicle slideshow: slide 1 hooks with productivity question, slides 2-6 one habit with routine graphic, slide 7 recap. Feature calendar icons, checklist visuals, and time block diagrams. Habit lists appeal to busy PMs for daily use.
SaaS SEO Keyword Research Process
10-slide step-by-step guide slideshow: slide 1 stat on organic traffic, slides 2-9 one step with tool-agnostic screenshot, slide 10 results example. Include search bar mockups, keyword clouds, and rank graphs. Processes guide beginners to actionable results.
Customer Interview Questions for SaaS
8-slide tips carousel: slide 1 importance hook, slides 2-8 one question category with 3 examples, slide 9 template CTA. Use speech bubble graphics, numbered lists, and interview scene illustrations. Question templates get saved for research.
SaaS Dashboard Design Best Practices
9-slide educational carousel: slide 1 bad dashboard example, slides 2-8 one practice with before/after, slide 9 checklist. Feature wireframe sketches, metric layouts, and color palette swatches. Design tips improve user experience focus.
Viral SaaS Referral Program Examples
7-slide product roundup slideshow: slide 1 hooks with growth stats, slides 2-6 one example with mechanic breakdown, slide 7 build tips. Use flowchart icons, reward visuals, and share button graphics. Roundups inspire replication.
Net Promoter Score Calculation Guide
6-slide tutorial slideshow: slide 1 NPS definition, slides 2-5 calculation steps with math visuals, slide 6 benchmarks. Employ score dials, formula equations, and response pie charts. Simple math guides non-analysts.
SaaS Content Marketing Funnel Stages
8-slide data visualization slides: slide 1 funnel overview, slides 2-7 one stage with metrics and content types, slide 8 optimization. Feature funnel diagrams, conversion graphs, and content icons. Funnel visuals clarify strategy.
A/B Test Result Analysis Framework
7-slide educational carousel: slide 1 test setup, slides 2-6 analysis steps with example data, slide 7 common errors. Use split test visuals, stat pads, and confidence interval bars. Frameworks reduce testing guesswork.
SaaS Email Sequence for Trials
9-slide step-by-step guide slideshow: slide 1 drop-off stat, slides 2-8 one email with subject/objective, slide 9 results. Include email mockups, timeline graphics, and open rate icons. Sequences provide copy-paste value.
MRR Growth Levers for Early SaaS
6-slide listicle slideshow: slide 1 MRR definition, slides 2-6 one lever with tactic and metric, slide 7 combo tip. Feature lever icons, growth arrows, and revenue charts. Lever lists target bootstrapped founders.
Integrations Page Layout Ideas
8-slide tips carousel: slide 1 conversion impact, slides 2-8 one layout with pros and mockup, slide 9 CTA. Use logo grid visuals, category badges, and search bar elements. Layout ideas speed up page builds.
SaaS Competitor Analysis Template
10-slide educational carousel: slide 1 template overview, slides 2-9 sections like features/pricing with fillable grids, slide 10 usage. Employ table templates, SWOT quadrants, and comparison charts. Templates drive downloads and follows.
User Retention Loop Components
7-slide data visualization slides: slide 1 loop diagram, slides 2-6 one component with metric, slide 7 measurement. Feature cycle arrows, retention curves, and engagement metrics. Loop breakdowns educate on stickiness.
SaaS Launch Checklist Essentials
12-slide tips carousel: slide 1 launch stat, slides 2-11 one item grouped by phase, slide 12 timeline. Use phased checklists, rocket icons, and deadline calendars. Checklists ensure complete launches.
Conversion Rate Benchmarks by Industry
6-slide comparison slideshow: slide 1 overview, slides 2-5 B2B/SaaS/consumer charts, slide 6 improvement tips. Include bar graphs, industry icons, and percentile lines. Benchmarks motivate optimization.
Ready to start automating?
Join hundreds businesses growing with Renderfire
Feature Request Triage Process
8-slide step-by-step guide slideshow: slide 1 backlog pain, slides 2-7 triage steps with criteria, slide 8 tools note. Feature voting boards, priority matrices, and decision trees. Processes organize chaos.
SaaS Billing Cycle Optimization
7-slide educational carousel: slide 1 churn link, slides 2-6 optimization tactics with flow, slide 7 metrics. Use calendar cycles, payment icons, and reduction graphs. Billing tips reduce involuntary churn.
Growth Experiment Tracking Sheet
9-slide listicle slideshow: slide 1 experiment stat, slides 2-8 columns like hypothesis/metric, slide 9 example fill. Employ spreadsheet mockups, experiment cards, and result icons. Tracking sheets enable scaling.
SaaS Homepage Hero Section Formulas
6-slide tips carousel: slide 1 hero impact, slides 2-6 formula with elements and example text. Use screen mockups, headline breakdowns, and CTA button visuals. Hero tips boost first impressions.
Customer Success Milestones Timeline
8-slide storytelling slideshow: slide 1 journey hook, slides 2-7 milestone with action/metric, slide 8 expansion. Feature timeline graphics, milestone markers, and progress bars. Timelines map long-term value.
SaaS Unit Economics Breakdown
7-slide data visualization slides: slide 1 key terms, slides 2-6 metric formulas with examples, slide 7 health check. Include equation visuals, ratio pies, and breakeven lines. Economics educate on profitability.
Trial to Paid Conversion Tactics
9-slide listicle slideshow: slide 1 average stat, slides 2-8 one tactic with implementation, slide 9 stack. Use conversion funnels, tactic icons, and uplift charts. Tactics target core revenue metric.
SaaS Changelog Best Practices
6-slide educational carousel: slide 1 engagement stat, slides 2-5 practice with example formats, slide 6 template. Feature changelog mockups, update categories, and notification bells. Practices improve transparency.
Product Roadmap Visualization Methods
8-slide comparison slideshow: slide 1 methods overview, slides 2-7 one method with pro/con grid, slide 8 choice guide. Employ timeline vs kanban visuals, stakeholder icons, and flexibility scales. Methods aid planning.
SaaS Support Ticket Response Framework
10-slide step-by-step guide slideshow: slide 1 resolution stat, slides 2-9 response steps with scripts, slide 10 metrics. Use ticket mockups, empathy phrases, and close loops. Frameworks standardize support.
Annual Recurring Revenue Projections
7-slide data visualization slides: slide 1 projection basics, slides 2-6 scenarios with charts, slide 7 sensitivity. Feature line forecasts, bar scenarios, and growth levers. Projections plan fundraising.
SaaS Feedback Loop Integration
8-slide educational carousel: slide 1 loop importance, slides 2-7 integration points with examples, slide 8 close. Include cycle diagrams, source icons, and action arrows. Loops connect users to roadmap.
Mobile App SaaS UX Patterns
9-slide tips carousel: slide 1 mobile stat, slides 2-8 pattern with swipe gesture illo, slide 9 test tips. Use screen flows, gesture hands, and pattern libraries. Patterns enhance cross-platform.
SaaS Partnership Activation Steps
7-slide step-by-step guide slideshow: slide 1 partner value, slides 2-7 activation with milestone, slide 8 scale. Feature handshake icons, joint funnels, and revenue shares. Steps unlock co-marketing.
Customer Lifetime Value Models
6-slide comparison slideshow: slide 1 CLV formula, slides 2-5 model types with calcs, slide 6 application. Employ formula breakdowns, cohort tables, and predictive curves. Models inform pricing.
SaaS Analytics Dashboard Templates
10-slide product roundup slideshow: slide 1 dashboard need, slides 2-9 template category with layout, slide 10 customize. Use widget grids, KPI cards, and filter visuals. Templates save design time.
Downtime Communication Protocols
8-slide listicle slideshow: slide 1 trust stat, slides 2-7 protocol with channel/timing, slide 8 recovery. Feature alert icons, status page mockups, and update timelines. Protocols maintain reliability image.
SaaS Brand Voice Guidelines
7-slide educational carousel: slide 1 voice impact, slides 2-6 guideline with do/don't examples, slide 7 audit. Use tone sliders, phrase pairs, and personality icons. Guidelines ensure consistency.
Expansion Revenue Opportunity Map
9-slide data visualization slides: slide 1 expansion types, slides 2-8 map with upsell paths, slide 9 prioritize. Feature opportunity trees, seat add-ons, and module unlocks. Maps target low-hanging fruit.
SaaS Waitlist Growth Strategies
6-slide tips carousel: slide 1 waitlist stat, slides 2-6 strategy with mechanic, slide 7 launch tie-in. Use queue visuals, referral loops, and teaser graphics. Strategies build pre-launch hype.
Beta User Engagement Tactics
8-slide listicle slideshow: slide 1 retention goal, slides 2-7 tactic with channel, slide 8 feedback. Feature engagement metrics, slack icons, and survey prompts. Tactics convert testers to advocates.
SaaS Security Feature Checklist
10-slide tips carousel: slide 1 trust signal, slides 2-9 feature with icon/description, slide 10 badge. Use lock icons, compliance badges, and layer diagrams. Checklists reassure enterprise prospects.
Quarterly Goal Setting Framework
7-slide step-by-step guide slideshow: slide 1 OKR stat, slides 2-7 setting steps with examples, slide 8 review. Employ goal pyramids, key result tables, and progress trackers. Frameworks align teams.
SaaS Case Study Structure Outline
9-slide educational carousel: slide 1 case power, slides 2-8 section with content tips, slide 9 CTA. Use story arcs, metric highlights, and testimonial quotes. Outlines produce credible proof.
Inbound Lead Qualification Criteria
6-slide comparison slideshow: slide 1 qual importance, slides 2-5 criteria tiers with scores, slide 6 process. Feature scorecard visuals, fit maps, and pipeline filters. Criteria streamline sales.
Create SaaS content with Renderfire


Content Ideas FAQ
Start Creating Today
Flexible plans for every stage.
Save 40% with annual billing.
More SaaS Resources
50 Instagram Video Ideas for SaaS Teams 2026
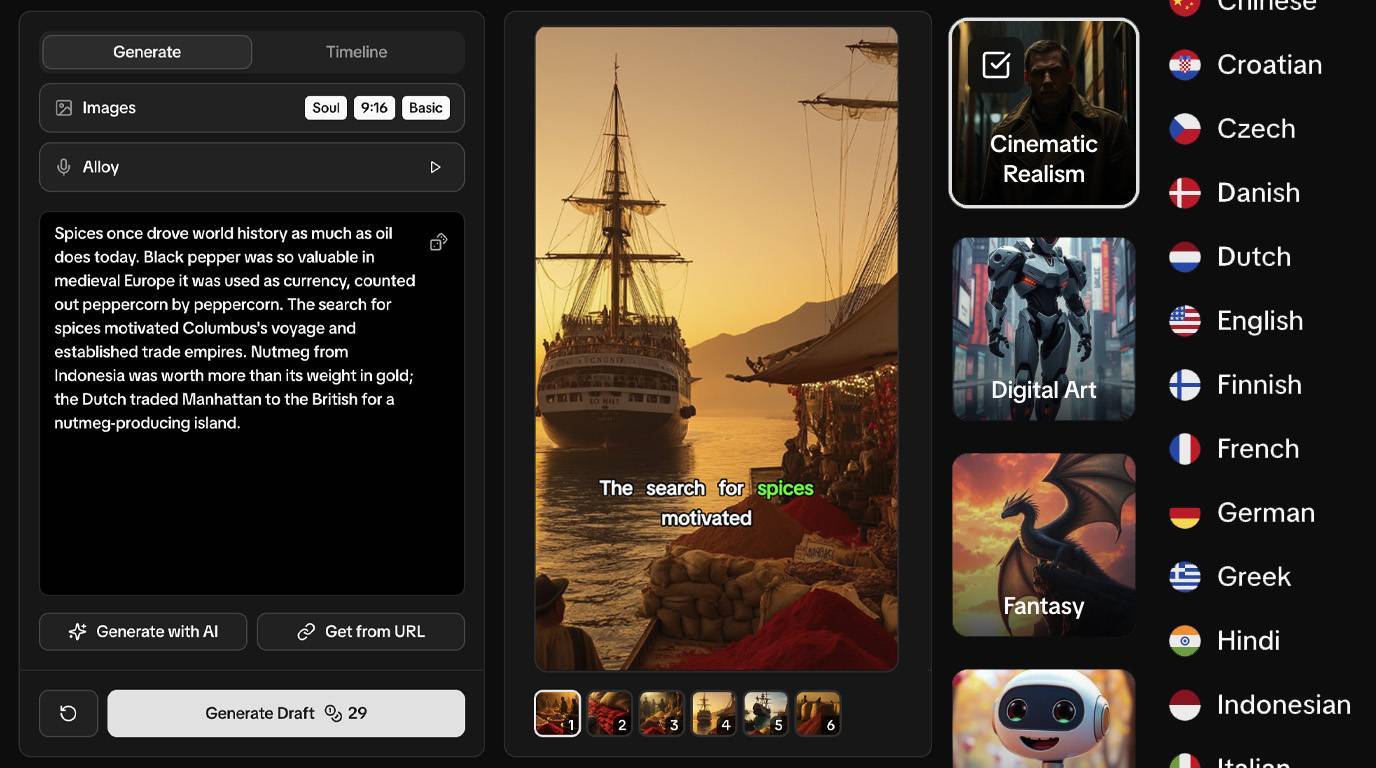
Discover 50 ready-to-produce faceless video ideas tailored for SaaS founders and growth marketers. Use image slideshows, UGC-style AI avatars, greenscreen memes, and more to build organic reach without showing your face. Drive signups through educational tips, feature breakdowns, and customer stories optimized for Instagram Reels.
30 UGC Video Ideas for SaaS Teams 2026
This collection provides 30 distinct, executable faceless video concepts tailored for SaaS founders and growth marketers. Each idea uses AI avatars in UGC-style formats like testimonials, demos, and stories to deliver value through hooks, problem-solution narratives, and soft CTAs. These videos address key pain points such as content consistency, feature explanation, and organic acquisition, optimized for Instagram Reels to drive saves, shares, and signups without on-camera talent.
60 Hooks for SaaS Teams 2026
Generate engaging, faceless Instagram Reels, TikToks, and Shorts with these 60 hooks tailored for SaaS founders and growth marketers. Each hook pairs with proven faceless formats like slideshows, AI UGC videos, chat mockups, and greenscreen memes to drive organic traffic and signups without paid ads or on-camera talent.
40 Meme Ideas for SaaS Teams 2026
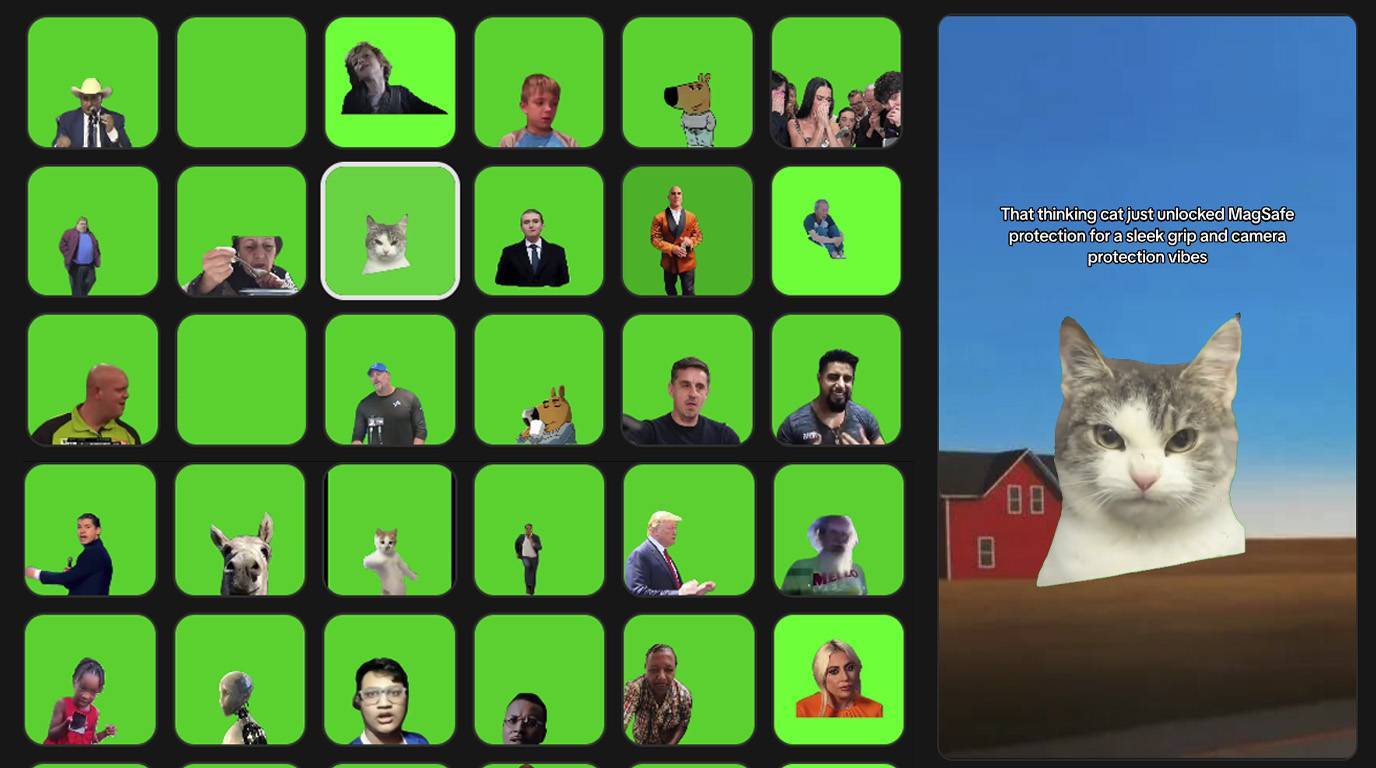
Generate engagement with these 40 faceless greenscreen meme video ideas tailored for SaaS founders and growth marketers. Each uses screenshots, text overlays, or stats on the background with humorous commentary to highlight pain points like content consistency, churn, and organic growth, driving saves and shares on Instagram Reels.
Free Marketing Courses
Step-by-step courses to master social media marketing. From beginner setup to advanced monetization strategies.
Free Marketing Tools
Powerful tools to download videos, edit images, analyze content, and supercharge your marketing workflow.
Ready to start automating?
Join hundreds businesses growing with Renderfire